EXHIBITIONS

The Warsaw Data

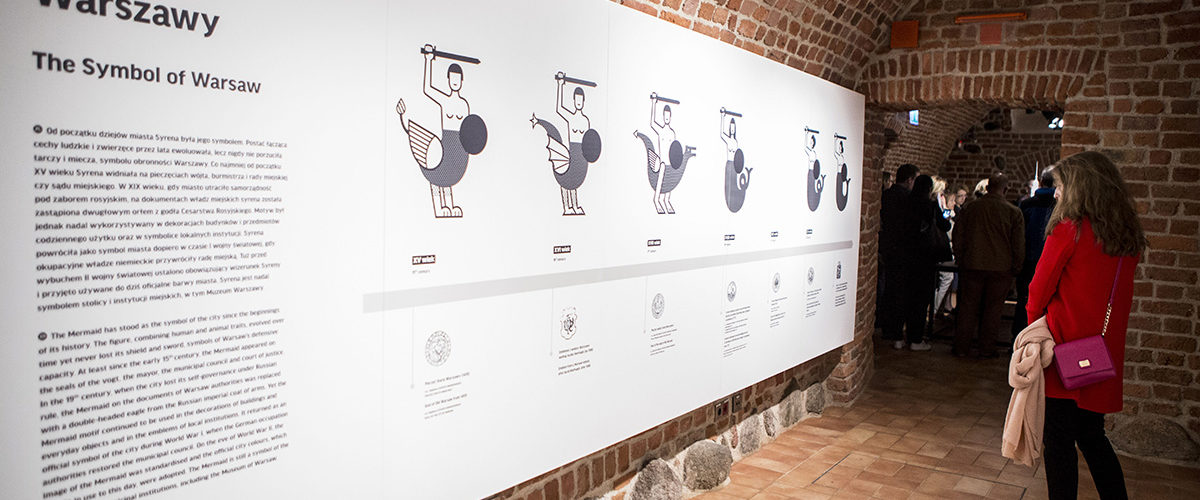
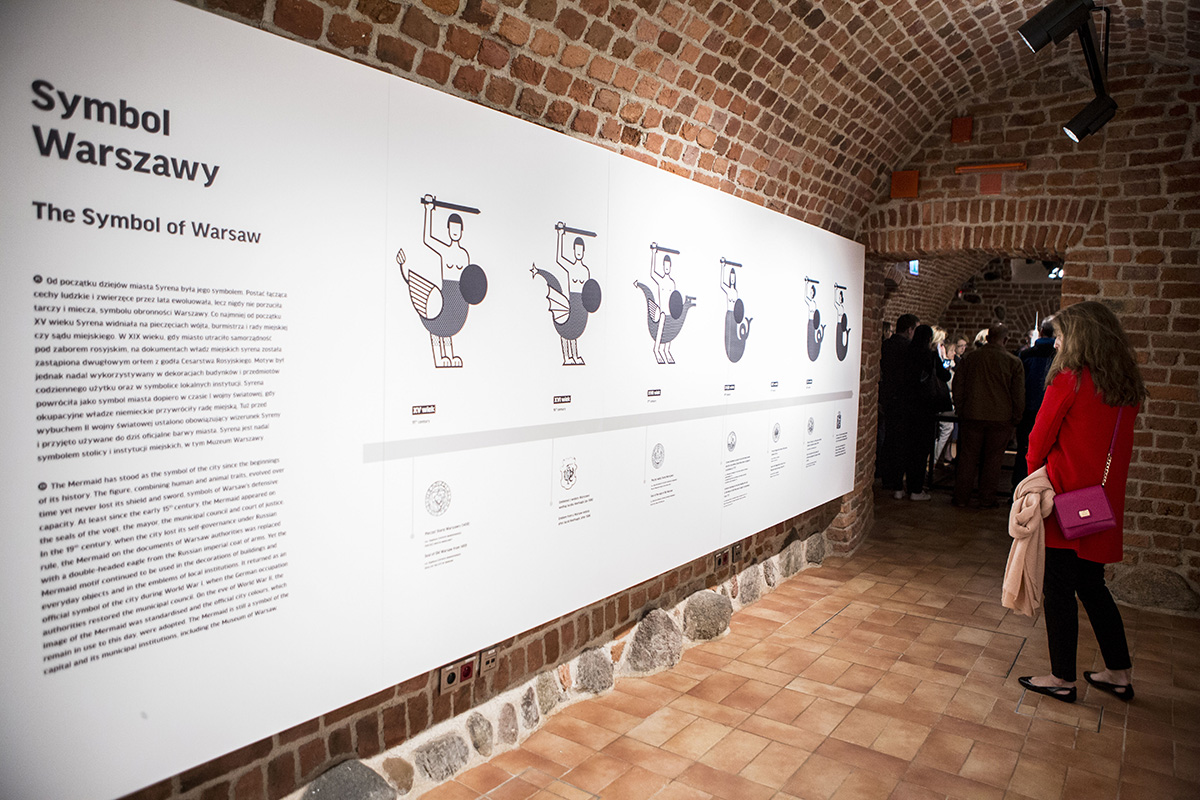
Statistical data gives us knowledge about reality expressed in the abstract language of mathematics. This section of the exhibition attempts to capture the unique character of Warsaw through the lens of such data, presented in the form of charts. maps and other graphic rep resentations. We encourage visitors to look for answers to questions that can be asked about any city. What forces drive a city’s develop ment? Who are and who were its residents? How did and how do they live? Where is its centre and boundaries?
Data offers the possibility of verifying stereotypes and popular opinions concerning Warsaw, its residents and urban space, as well as of pinpointing events and phenomena that have influenced the city’s current shape and unique character.
Systematic statistical studies have been conducted in Warsaw since the second half of the 19th century, although basic data, primarily demo graphic and tax-related, was gathered earlier. Not only did methods of gathering data evolve. The way data was classified and interpreted did as well. Cartographic representations preceded the collection of statistical data . The oldest surviving map of Warsaw is Hoppe’s plan which dates back to 1641.
We have selected data that enables comparison and highlights long-term phenomena and processes. This allows us to distinguish periods of economic and social transformation. Warsaw’s changing political affiliation over time, spatial and demographic growth, architectural metamorpho ses and civilisation jumps. The material was selected so as to provide basic knowledge to visitors encountering Warsaw for the first time and to inspire those already familiar with the city.
Curators: Paweł Jaworski, Zofia Oslislo-Piekarska, Grzegorz Piątek, Karol Piekarski, Klementyna Świeżewska
Graphic design: Ania Światłowska


